Data highlight
May 1, 2024
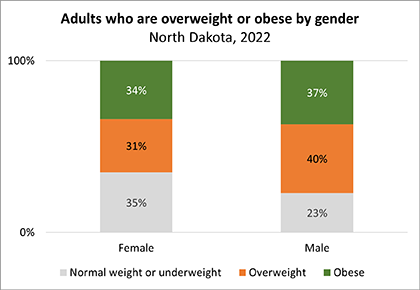
More than 3 in 4 North Dakota adult males are overweight or obese.
Overweight and obesity are conditions characterized by an excessive accumulation of fat cells in the body that can impair individuals’ health. Obesity specifically is a complex chronic disease which can lead to additional health issues such as type 2 diabetes, heart disease, and some cancers. It can also impact reproductive and bone health, in addition to affecting activities of daily living like the ability to move and sleep.
Data from the 2022 Behavioral Risk Factor Surveillance Survey (BRFFS) reveals that an estimated 36 percent of North Dakota adults are overweight, with an additional 35 percent are classified as obese. Notably, while the prevalence of overweight North Dakota adults has remained steady since 2011 at 36 percent, when compared to other states, North Dakota's ranking has shifted from 31st in 2011 to 44th in 2022 (with the lowest percentage of adults who are overweight ranking first). Similarly, the obesity rate has increased from 28 percent in 2011 to 35 percent in 2022, accompanied by a rise in the national ranking from 26th to 33rd.
Among North Dakota adults, males are more likely than females to be overweight or obese. In 2022, 31 percent of females were overweight, with an additional 34 percent classified as obese, whereas 40 percent of males were overweight and 37 percent were obese. While the percentage of overweight males or females has seen marginal change, the obesity rate among North Dakota adult males has increased from 30 percent in 2011 to 37 percent in 2022. Similarly, the obesity rate of adult females has increased from 25 percent in 2011 to 34 percent in 2022.
Encouraging healthy lifestyle habits to combat overweight and obesity is important for promoting well-being and reducing the incidence of related chronic diseases in the state.
Note:
Weight and height responses in the BRFFS survey of adults, age 18 and older, were used to determine a body mass index (BMI). Respondents were classified as overweight if their BMI was equal to or greater than 25.0, but less than 30.0. They were classified as obese if their BMI was 30.0 or greater.
Explore the Overweight and Obesity dashboard
April 1, 2024
Western North Dakota counties gain population, reversing a downward trend.

From July 2022 to July 2023, North Dakota’s population increased by 5,014 people overall. According to the most recent county population estimates released by the Census Bureau on March 14, 2024, Cass County leads North Dakota counties in population increase by adding 3,649 residents during this time period. Williams County followed Cass County in population gain with an addition of 1,147 people and Burleigh County added 616 people. Another 14 counties gained population in addition to the three mentioned. The remaining 36 counties lost population, with Ward, Walsh, and Rolette counties losing at least 100 people each. Ward County had the largest decrease, with a loss of 456 people.
Percentage wise, Williams County leads the North Dakota counties in percent of population growth (3%) from 2022 to 2023 and the Williston micropolitan area, which is comprised of Williams County, is among the five fastest-growing U.S. micropolitan areas during the same time period. This is remarkable, considering that Williams County lost population the previous two years (-2,683 people in 2021 and -533 people in 2022). McKenzie County also increased its population by 2.6 percent from 2022 to 2023 after only a small increase of 0.2 percent in the previous year and a loss of 6.2 percent in 2021.
Other western counties also reversed their downward trend in population change. Mountrail County’s population increased by 1.5 percent in 2023 after losing 3.4 percent of its population in 2022 and 2.4 percent in 2021. Stark, Hettinger, Adams and Burke are also among counties with a slight increase in population following declines in the previous two years. While the population increase in the western counties is due to both natural change and in-migration, the reversal of trends is due to more people entering the counties (in-migration) than leaving the counties as compared to the opposite in the previous two years.
Color legend:
The darker the green the largest the population gain
The darker the blue, the largest the population loss
Source: U.S. Census Bureau, Population and Housing Unit Estimates, Vintage 2023 Estimates
View topic:DEMOGRAPHICS / POPULATION
March 1, 2024
A glimpse into North Dakota’s older workforce.

Over the past two decades, the number of older adults (age 65 and older) in North Dakota who are employed has more than doubled, from 12,956 in 2000 to 27,715 in 2022. The growth can partly be attributed to the aging population, particularly with the onset of the baby boom cohort reaching 65 in 2011. Additional factors such as increased educational attainment among older adults, higher life expectancies, changing retirement policies, and the availability of age-friendly employment opportunities have all contributed to this trend.
North Dakota has consistently surpassed the national average since 2010 in terms of its proportion of older adults who remain in the workforce. In 2022, 21 percent of the state’s older adult population was employed, compared to 18 percent nationwide. There is a gender disparity in post-retirement employment, with males being more likely to continue working compared to females. In 2022, 26 percent of North Dakota’s males, age 65 and older, were employed, in contrast to 17 percent of females. Breaking down the data by age groups, 38 percent of older adults age 65 to 69 were still in the workforce, followed by 22 percent of those age 70 to 74, and 7 percent of individuals older than 75, in North Dakota in 2022.
Note:
The percent of adults who are employed represents the number of people who are employed divided by the total civilian population (civilian labor force plus people not in the labor force). A person is counted as employed if they did any work during the reference period as a paid employee, worked in their own business or profession (including farming), or worked 15 or more unpaid hours a week as part of a family business or farm..
View topic: WORKFORCE / Proportion of adults working
February 1, 2024
The educational profile of older adults in North Dakota saw a significant improvement since 2010.

Educational attainment refers to the highest level of education completed (e.g., a high school diploma, a bachelor's degree, or a master's degree). In 2022, approximately 9 in 10 adults (age 25 and older) had at least a high school diploma or GED (94%), 1 in 3 of adults (32%) had a bachelor’s degree or higher, and 6 percent of adults had less than high school education.
Educational attainment increased overall in North Dakota from 2010 to 2022. While the percentage of adults age 25 to 64 with at least a high school education and at least a bachelor’s degree saw less change, a notable shift occurred among older adults (age 65 and older).
During this time frame, the educational profile of older adults saw a significant improvement. The percentage of older adults with at least a high school education increased from 75 percent in 2010 to 92 percent in 2022. Additionally, the proportion of older adults holding a bachelor's degree or higher rose from 15 percent in 2010 to 26 percent in 2022. This shift can be attributed to the replacement of cohorts that have less formal education with cohorts that have greater levels of formal education in the older age groups.
View topic: WORKFORCE / Educational Attainment
January 1, 2024
North Dakota continues to gain population in 2023.

North Dakota reached 783,926 people (as of July 1, 2023), according to the population estimate released in December 2023 by the U.S. Census Bureau’s Population and Housing Units Estimates Program. This is an increase of 5,014 people from the 2022 estimate of 778,912 (which is a revised 2022 estimate). Annual releases of population and housing unit estimates involve revisions to yearly estimates going back to the most recent decennial census and are based on updated administrative records, geographic boundaries, and methodology. A look at the components of change over the past three years reveals notable trends. Although annual births saw a slight decline, a corresponding decrease in deaths resulted in an overall growth in natural change (births minus deaths). Most recently, North Dakota recorded 9,649 births and 6,945 deaths from July 1, 2022 to July 1, 2023, accounting for a net natural increase of 2,704.
Another significant factor in population change is net migration, calculated as the difference between individuals entering the state (in-migration) and those leaving (out-migration). In the period from July 1, 2022, to July 1, 2023, North Dakota experienced a positive net migration, which deviates from the negative trends in the previous two years (negative 3,555 in 2021 and negative 1,467 in 2022). This positive shift is attributed to an increase in international migration (2,298 people) and minimal domestic out-migration (-9 people) compared to previous years.
Maintaining a positive natural increase and the ability to attract and retain residents contributes to North Dakota’s continued population increase.
Source: U.S. Census Bureau, Population and Housing Unit Estimates Vintage 2023 Estimates
Data Highlight Archive
Center for Social Research
North Dakota State University
Compass created by:
Wilder Research
© 2024. All rights reserved.